Which countries emit the most greenhouse gases globally?
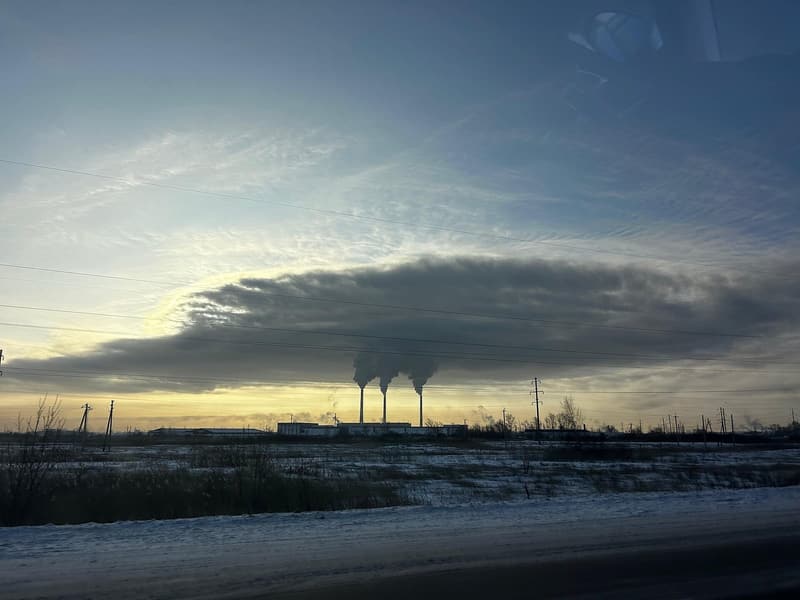
Representative photo · Photo: PlainVector / Wikimedia Commons, CC0
Global greenhouse gas emissions reached 54.1 billion tonnes in 2025, driven largely by power generation, industry, and transport.
World leaders and delegates are gathering in Antalya, Turkiye, for COP31, the annual United Nations climate summit running from November 9 to 20. They meet as global emissions continue to climb. The world emitted 54.1 billion tonnes of greenhouse gases in 2025, representing a 0.7 percent increase from the previous year and a 68.5 percent increase since 1990, according to figures from the European Commission’s Joint Research Centre and the International Energy Agency.
Greenhouse gases such as carbon dioxide and methane trap heat in the atmosphere, driving up global temperatures and intensifying heatwaves, droughts, and floods. Carbon dioxide accounted for 73.8 percent of global greenhouse gas emissions in 2025, while methane made up 17.6 percent, nitrous oxide 5.3 percent, and fluorinated gases 3.3 percent. As these pollutants accumulate, ocean heat reached record levels in 2025, and extreme weather events caused severe devastation and fatalities across the globe in 2026.
Which countries are the largest emitters
Global emissions have more than doubled since 1970, rising from roughly 23 billion tonnes to 54.1 billion tonnes in 2025. The power sector remains the largest source, generating nearly 30 percent of global emissions due to high electricity demand in fast-growing economies like China and India. Industry accounts for 21 percent, and transport contributes 16 percent. Together, these three sectors produce about two-thirds of global emissions, with agriculture, fossil fuel extraction, buildings, and waste making up the rest.
In 2025, the three largest emitters generated nearly half of the world's total greenhouse gases. China emitted nearly 16 billion tonnes, accounting for 29.5 percent of the global total. The United States produced 6.02 billion tonnes, or 11.1 percent, and India emitted 4.51 billion tonnes, representing 8.3 percent. While Western nations drove early industrial emissions, rapid industrialization in countries like China during the 2000s shifted the balance of modern output.
Global emissions have more than doubled since 1970, with China, the US, and India leading total output.
Why it matters
Understanding which regions and sectors drive global emissions helps shape international climate negotiations as leaders attempt to curb rising temperatures. Rapidly growing energy demands in populous nations like India and China highlight the complex challenge of balancing economic development with global emissions reductions.
Sources
More like this

Charity Seeks Funds to Boost Bird and Bee Populations on Farmland

Recycling firms use technology to turn waste fabric into tomorrow's fashion
Smog Delhi: Diwali Firecrackers Deepen Air Crisis