
Market Analysis: A Prediction for the Stock Market and Historical Context
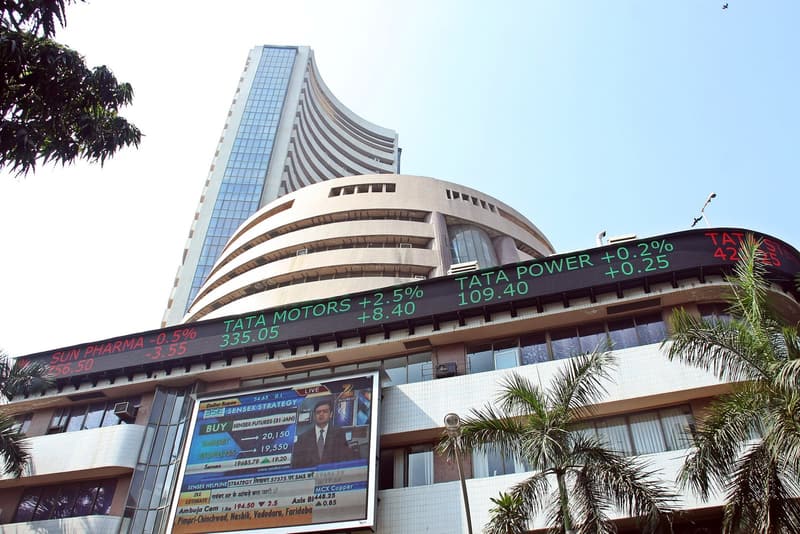
Representative photo · Photo: Jakub Hałun / Wikimedia Commons, CC BY 4.0
The S&P 500 faces potential headwinds from rising oil prices, inflation, and high interest rates as experts analyze historical market trends.
This is news, not investment advice. NexVani Media is not a SEBI-registered investment adviser and does not recommend buying or selling any security. Do your own research or consult a registered adviser before investing.
Investors are currently evaluating a complex economic landscape as they search for a reliable prediction for the stock market. The S&P 500 index has more than doubled from its 2022 bear market low, yet it now faces significant challenges that could threaten this bull run. Geopolitical conflicts, including the closure of the Strait of Hormuz and ongoing instability in the Middle East, have pushed West Texas Intermediate crude oil prices above $100 per barrel. This surge is driving up costs for transportation and fuel, contributing to an annualized inflation rate of 3.7% in September, which remains well above the Federal Reserve's 2% target.
In response to these inflationary pressures, the Federal Reserve implemented a 25-basis-point interest rate hike in September, with further increases potentially on the horizon. Rising rates increase the cost of debt for consumers and corporations, which can dampen discretionary spending and suppress corporate earnings. Furthermore, high interest rates make safer assets like Treasury bonds more attractive compared to volatile stocks. The technology sector, which accounts for 38% of the S&P 500, is particularly sensitive to these shifts, as companies face increased borrowing costs to fund massive infrastructure projects like data centers.
Historical context and market valuation
Beyond macroeconomic factors, the S&P 500 is trading at a Shiller Cyclically Adjusted Price-to-Earnings (CAPE) ratio exceeding 40. This level has only been reached once before, during the dot-com bubble leading up to 2000. While high valuations do not guarantee an immediate decline, they suggest the market is vulnerable to volatility. According to data from Capital Group, the S&P 500 has historically experienced a bear market decline of at least 20% every six years on average, and it has been four years since the last occurrence.
Historical data suggests that staying invested through market volatility has yielded long-term returns since 1957.
Despite these risks, historical data provides a perspective on long-term performance. Since its inception in 1957, the S&P 500 has delivered a compound annual return of 10.7%, successfully navigating various corrections and bear markets. Analysts suggest that panic-selling during downturns has historically been counterproductive, as those who remained invested have typically seen their portfolios recover over the long term.
Why it matters
The current market environment highlights the sensitivity of global indices to energy prices and central bank policies. For investors, these factors underscore the importance of understanding historical volatility and the potential impact of interest rate cycles on corporate valuations and economic growth.
Sources
More like this

Indian Stock Market Today: BSE Sensex and NSE Nifty Rally Amid Global Gains

Stock Recommendations for 5 November from MarketSmith India
Sensex Today Live: Indian Equities Jump as Oil Prices Ease